Business Info
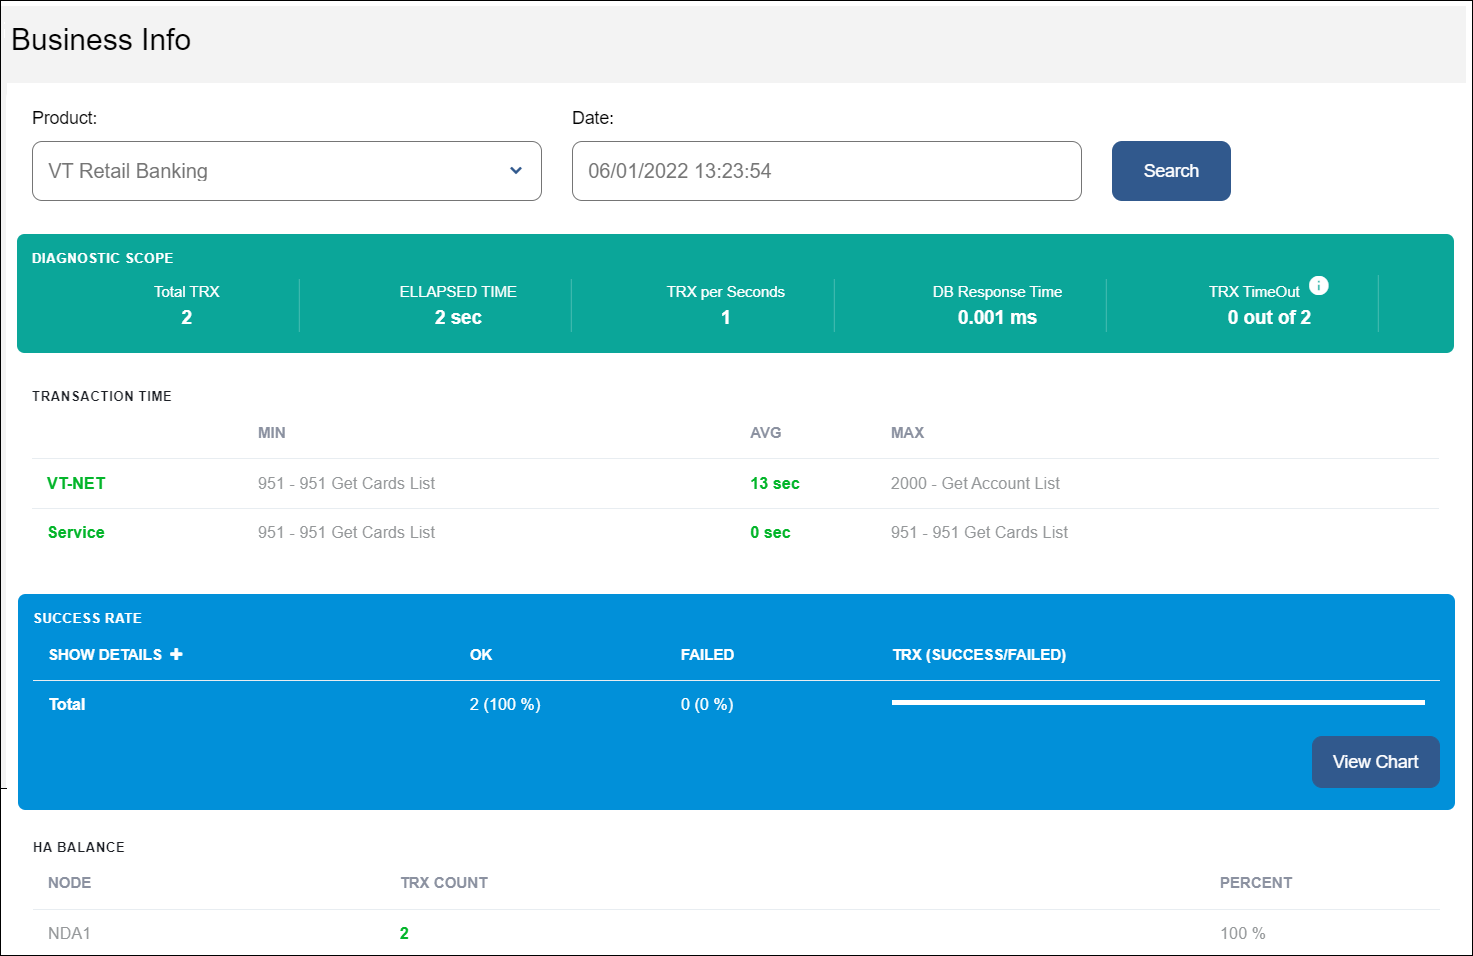
The Business Info page shows the transactions that were executed for a specified product in a particular moment, and allows you to assess the health of those transactions. It details average response times and success rates to detect errors in the transaction flow. This page appears as a dashboard when you access Middleware, and you can also access it by clicking Diagnostic > Business info in the top menu.
Select the product you want to analyze from the Product drop-down menu and pick a date and time on the Date field. A calendar opens where you must select both day and time. Then, click Search to obtain a list of transactions executed on the platform on the product and date previously selected, as shown below.
Continue reading to learn more about each section of this page.

This section shows the following fields:
Total TRX | Number of transactions that were executed during the selected period of time and for the specified product. |
Elapsed Time | Total execution time in seconds for all the transactions. |
TRX per Seconds | Number of transactions executed per second during the elapsed time. |
DB Response Time | Average time it took for transactions to connect with the database. |
TRX Timeout | Number of transactions that returned a timeout response after taking too long or failing to complete. |
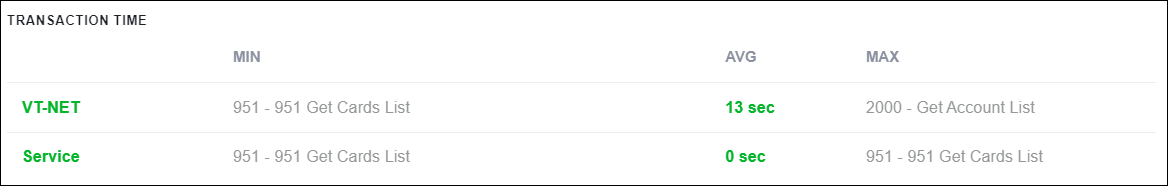
This section shows the average time it took for transactions to process or obtain a response from a service, and which specific transactions took the least and the most time to do so.
Transactions are separated in two rows: The VT-NET row shows transactions that execute within the platform, while the Service row details the transactions that obtain a response from a service.
For each row, there are columns that provide the following information:
Min | Transaction that took the least time to process or obtain a response from a service. |
Avg | Average time it took for a transaction to process or obtain a response from a service. |
Max | Transaction that took the longest to process or to obtain a response from a service. |
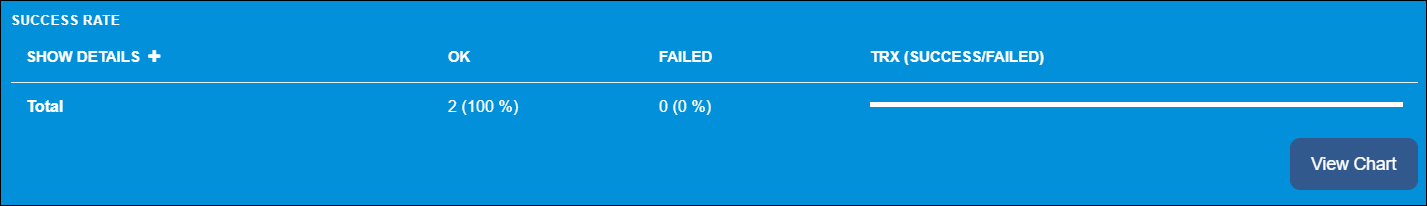
This section shows how many of the total of transactions executed successfully and how many failed for the selected product in the given time frame. It also shows a progress bar to express the transaction success rate in a graphic way.
This section appears as a table, with one row that expresses the total of transactions, and the following columns:
OK | Shows how many transactions were executed and succeeded. |
Failed | Shows how many transactions were executed and failed. |
TRX | Transaction success rate expressed in a progress bar. |
To see a detailed list of the transactions included in the total, click Show Details.
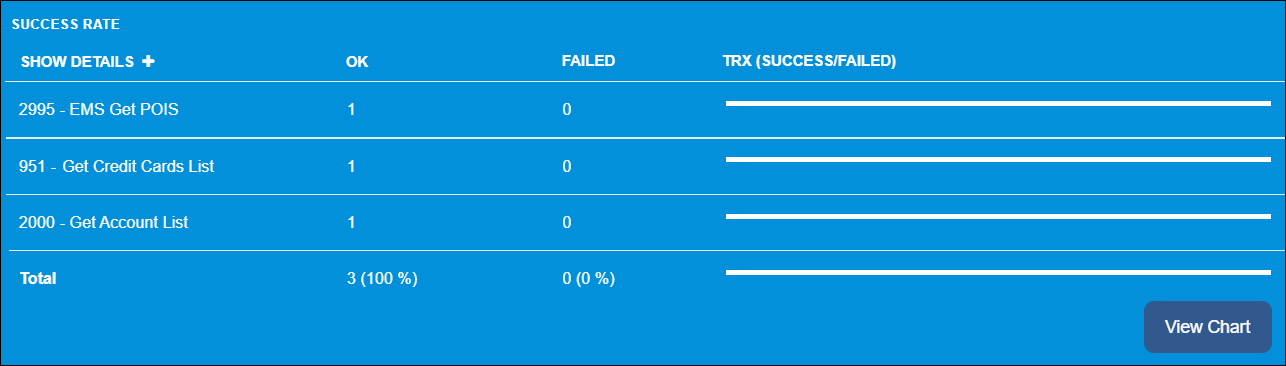
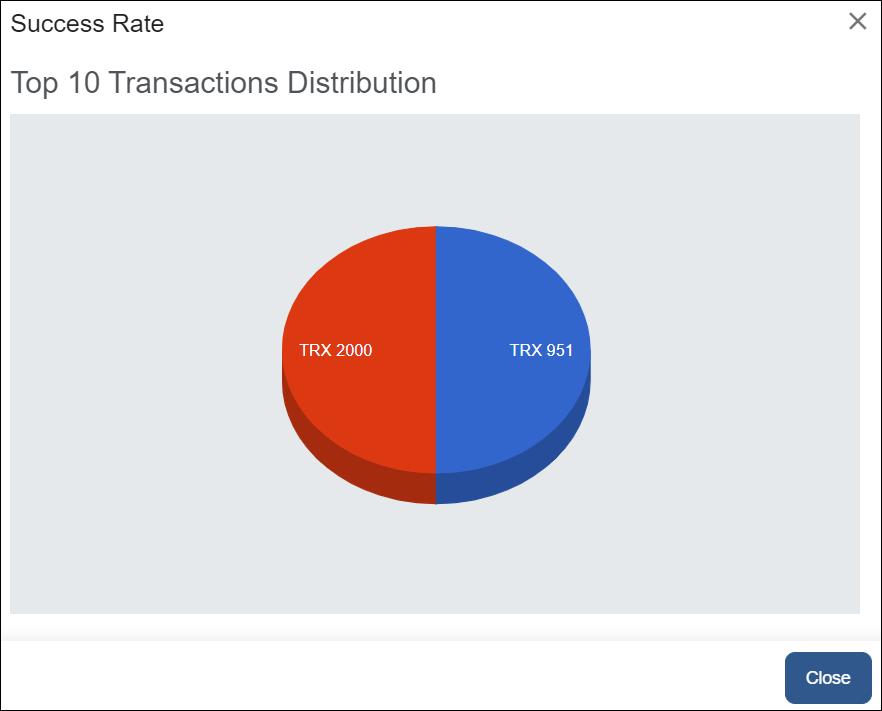
Click View Chart to see the 10 most relevant transactions from the detailed list in a pie chart that compares how many of each were executed successfully.
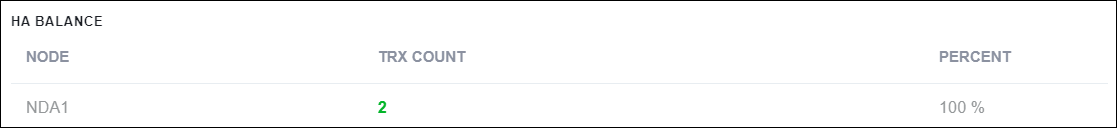
This section lists how many transactions were executed in each node available in the platform, regardless of whether they were executed successfully or not.
This section appears as a table with one row per node and the following columns: Trx Count, showing the total of transactions executed in that node, and Percent, showing what percentage of the total of transactions of the platform were executed in that node. See an example in the image below.