Status Detail
The Status Detail section displays health information about the different components or nodes consumed by Middleware. This allows you to verify if there are connection or configuration issues with any of those components.
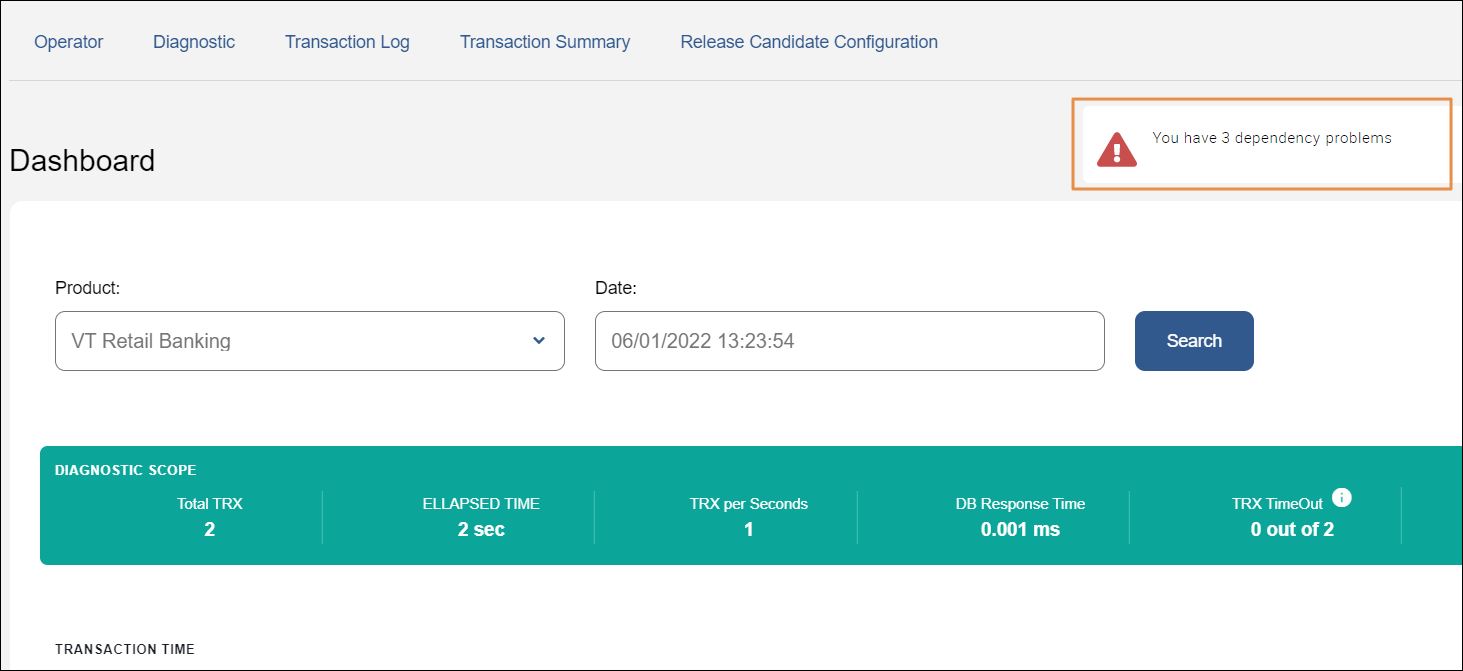
To access this section, click the dependencies status banner located on the top right corner of the dashboard. The banner indicates if there are any issues with the dependencies or not. The example below shows an environment that presents issues with Middleware's dependencies.
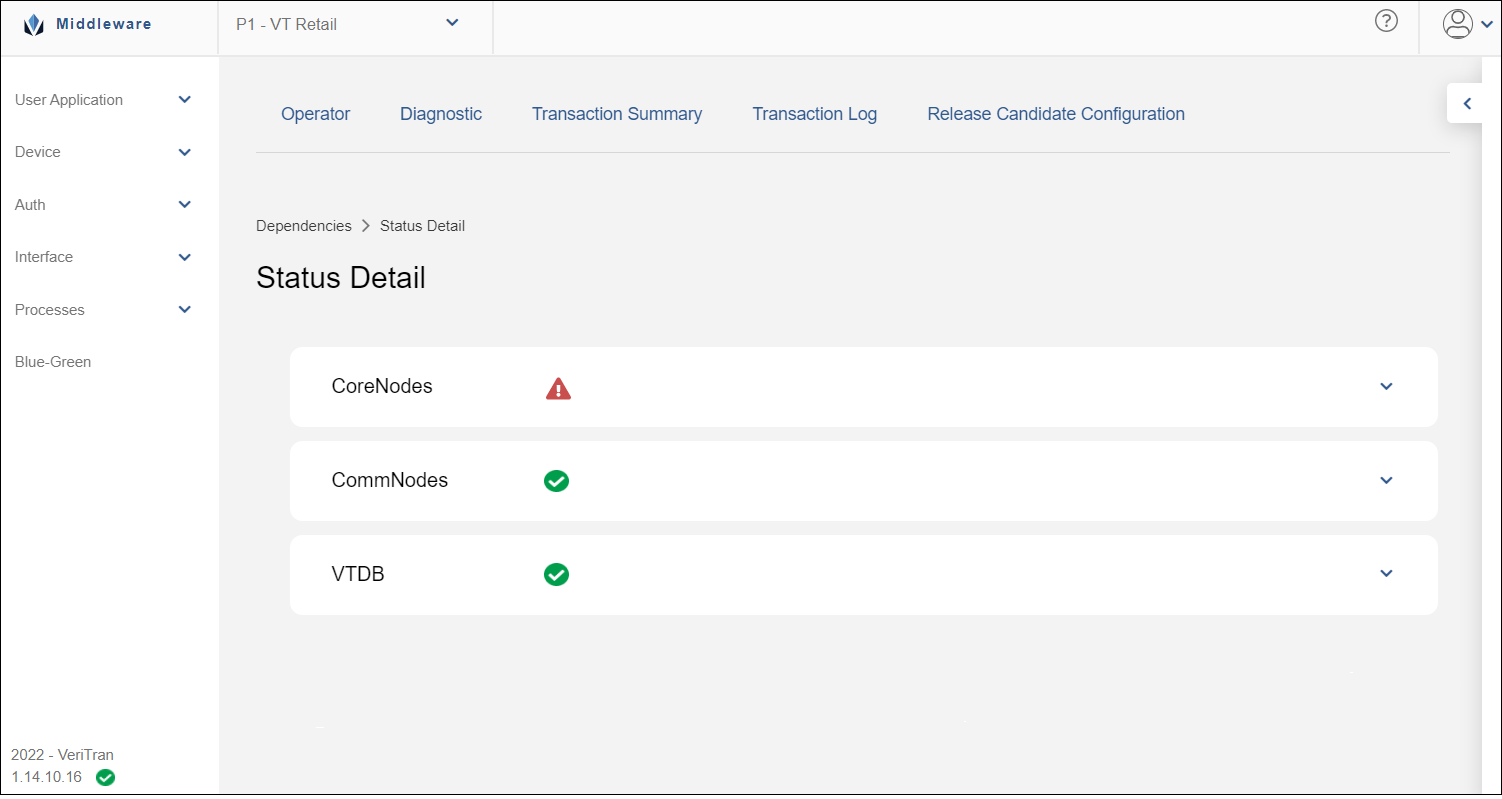
The Status Detail page opens. Here you can find a section for every node or component linked to Middleware and a status icon. A green check icon means there were no issues found within the component. If there is a red error icon, click the drop-down arrow next to the component to see more details about the issue.
When you click the drop-down arrow on a component that contains errors, the section displays details about the issues found, such as out of range ports or credentials issues, or any configuration errors. See the image below for an example.
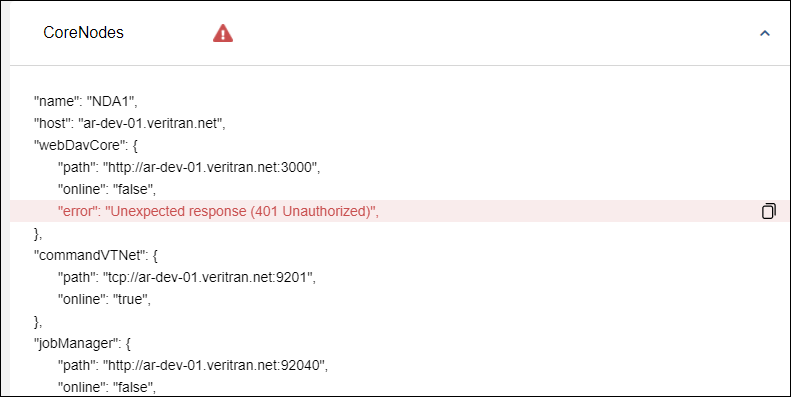
To copy an error's details, click the copy icon next to the issue.