Create or Edit a Lambda Process
You can create new lambda processes or edit existing ones from the Processes page (Branch Edition > Processes).
To create a new process, go to the Lambda processes tab. Then, click + New lambda process. The lambdas editor opens.
The lambdas editor is a visual programming tool that allows you to build your process by dragging and dropping puzzle-piece shaped blocks from the menu into the canvas and arranging them as needed. Blocks represent a variety of functions and operations that can involve transactions, registers, arrays, conditionals and more.
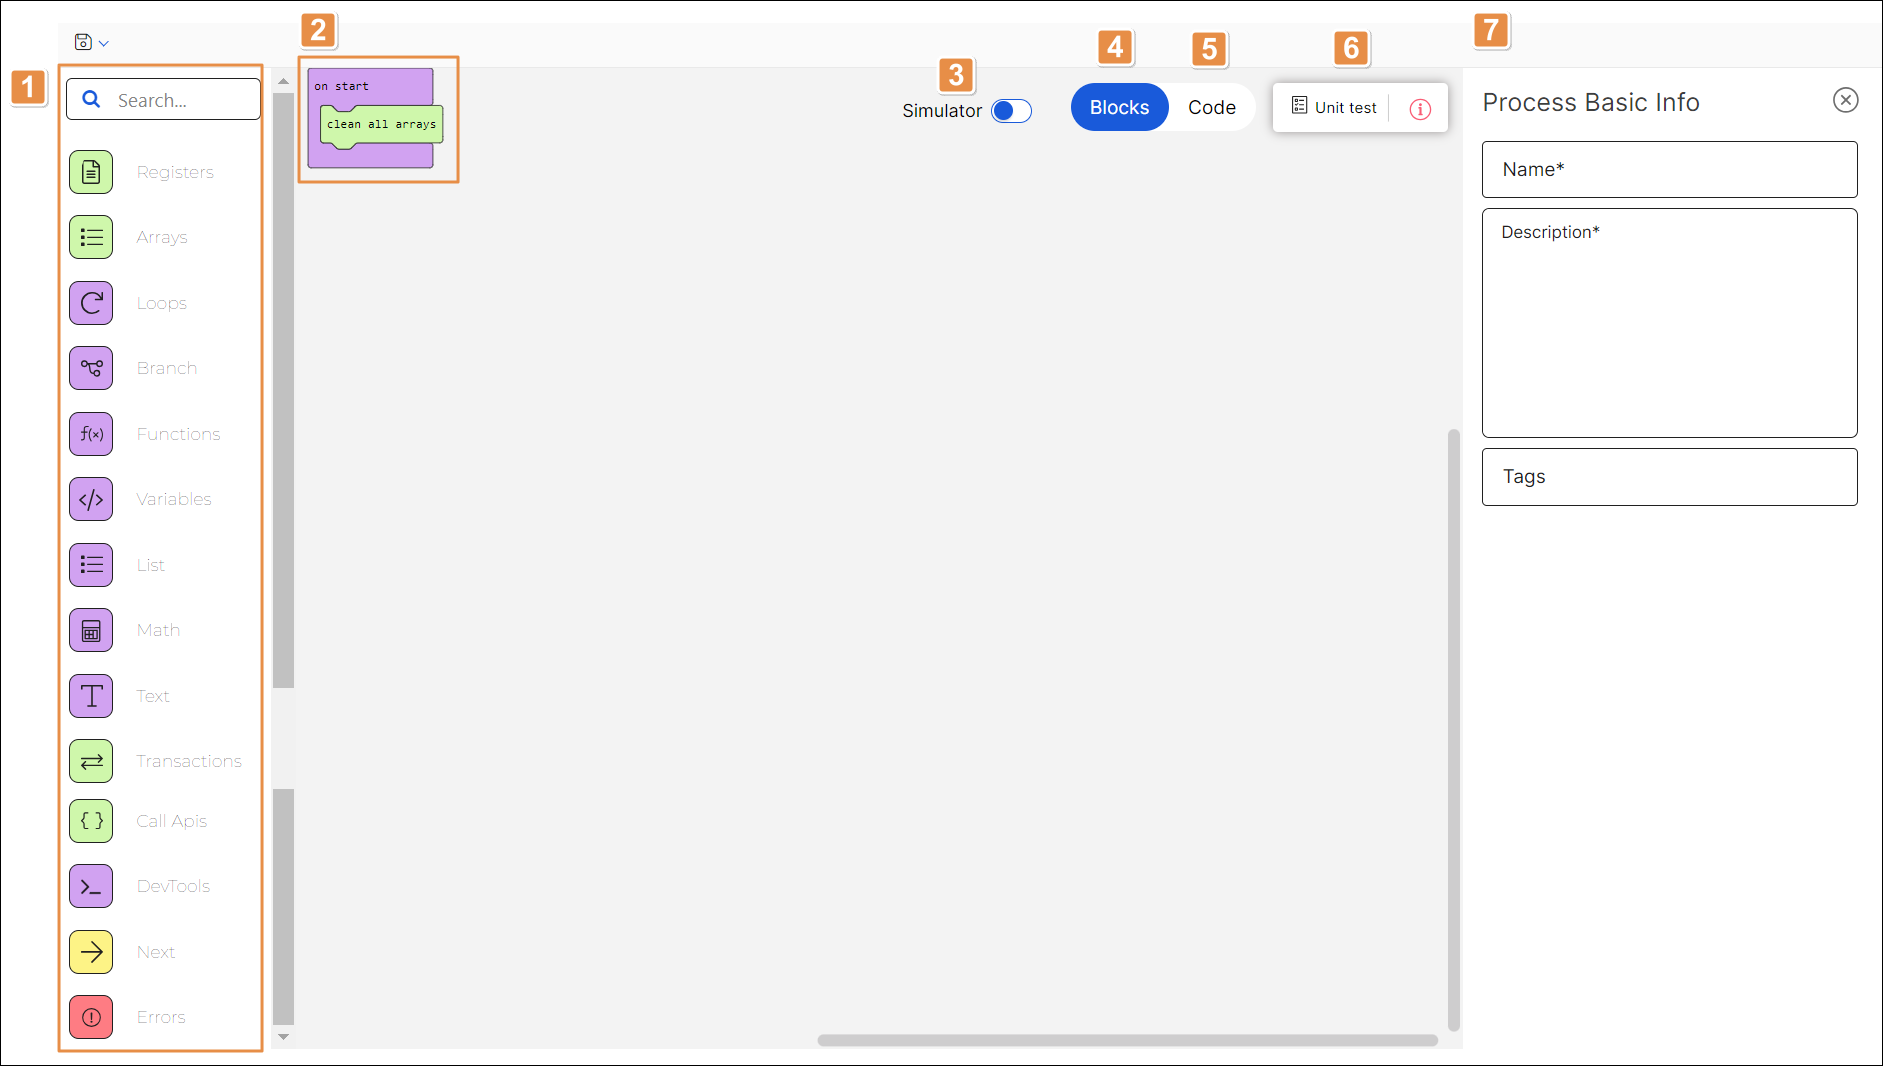
Refer to the annotated image below to learn more about the lambdas editor interface.
Click Save in the actions bar to save your lambda, and close the Lambdas [New] page to exit.
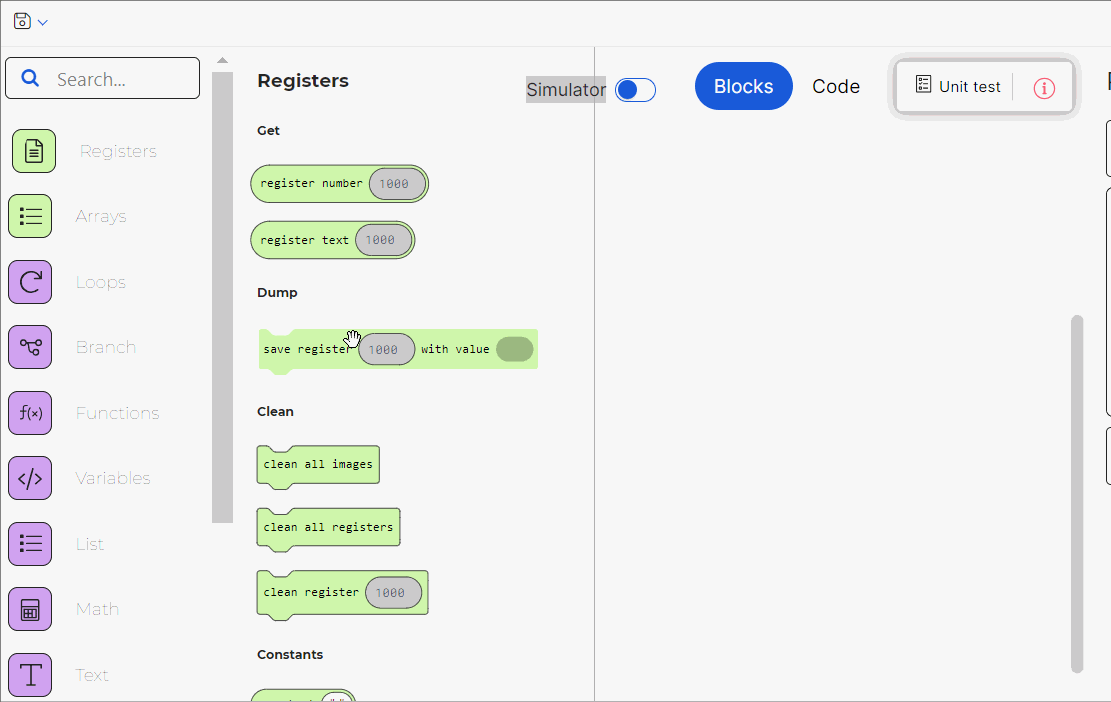
List of blocks. Click any category in the menu to see the blocks available. To find a block, type a keyword into the search bar. Blocks are displayed to the right of the blocks list so you can drag and drop them into the canvas.
Canvas. Section that displays the blocks added from the list and their interaction.
Simulator. Click the toggle to open the simulator. To close the simulator panel, click the toggle again. Read Simulator to learn more.
Blocks view. This view, open by default, allows you to use blocks to program your process visually. Read Work with Blocks to learn how to use this view.
Code view. Click this view to see or edit your process as javascript code. Read Work with Code to learn how to use this view.
Unit Test. Click to open the Lambda Unit tests panel and see the list of unit tests created for the process. Learn more about the Unit test panel in the table below.
Search bar
To find a unit test, click the search bar and type its name.
Run all tests
Click to run all the tests associated to the lambda.
Name
Name of the unit test to which the process is associated.
Status
Status of the unit test. The statuses available are: Ready to test, Preparing, Queued, Testing, Errors detected, Studio timeout, Engine failed and Without errors. If you don't run any tests in the lambda editor, the status remains Ready to test. If the resulting status is Errors detected, click the information icon to the left of the status to see the errors identified. Read Unit Tests to learn more.
Basic info. Complete the Name, Description and Tags fields to identify your process. Only the Name and Description fields are mandatory. Click Close to collapse this section. To open it again, click the information icon to the right of the Unit Test button.
Important
The process' name cannot be edited once created. Choose the name carefully.
Work with Blocks
To start, select a block category from the list to see the blocks available or use the search bar to find a specific block. Drag blocks from the menu and drop them into the canvas, arranging them as needed to program your process.
Important
By default, the on start block is included in the canvas. All blocks of the lambda process must be added within the on start block.
The blocks connect to each other vertically like a puzzle, where each block type has its own shape, and a specially shaped slot for it to be inserted into, which prevents syntax errors.
To delete a block, drag and drop it into the menu, or click it to select it (you will see the block highlighted in yellow) and press the Delete key. To undo any action, press CTRL + Z.
Refer to the list of blocks to find information about specific blocks, grouped by category.
Work with Code
Use the Code view to see and edit the javascript code that corresponds with your blocks. You can still use some of the blocks in the left menu to drag code into the canvas.
If there are any problems present in the code, the Problems section appears at the bottom of the screen. Click Problems to find out what the problem is and where to find it.
If you want to change the view before fixing a problem, a modal opens, specifying that the JavaScript code cannot be converted back to blocks. Click Stay in JavaScript (blue sign) to fix the problem or Discard and go back to blocks (red sign) to change the view and go back to the previous blocks version.
You can go back and forth between the blocks view and the code view as needed, as long as no problems appear.
Simulator
The simulator tool allows you to test the logic of the lambda process and to provide it with the input data required to work as expected.
To open it, click the Simulator toggle. Once it is activated, the toggle turns purple and the simulator panel opens to the left of the canvas.
For the simulation, you can either define a specific scenario or enter data manually. If you define a scenario, the simulation includes the input data set when the scenario was configured—including registers, arrays, call APIs and transactions—but you can still edit them as if you were adding them in the simulator from scratch. If you don't define a scenario, you can set registers, call APIs and transactions for that simulation process only.
The simulator also contains a debugging tool. This tool allows you to execute the lambda process's code and find any programming errors within the blocks. To run the debug, you can also set breakpoints to pause the debug in the desired block or blocks. If you don't use breakpoints, the entire lambda process is executed without stopping at any of its blocks.
The simulation starts running automatically once the simulator is activated. Refer to the image below to learn more.
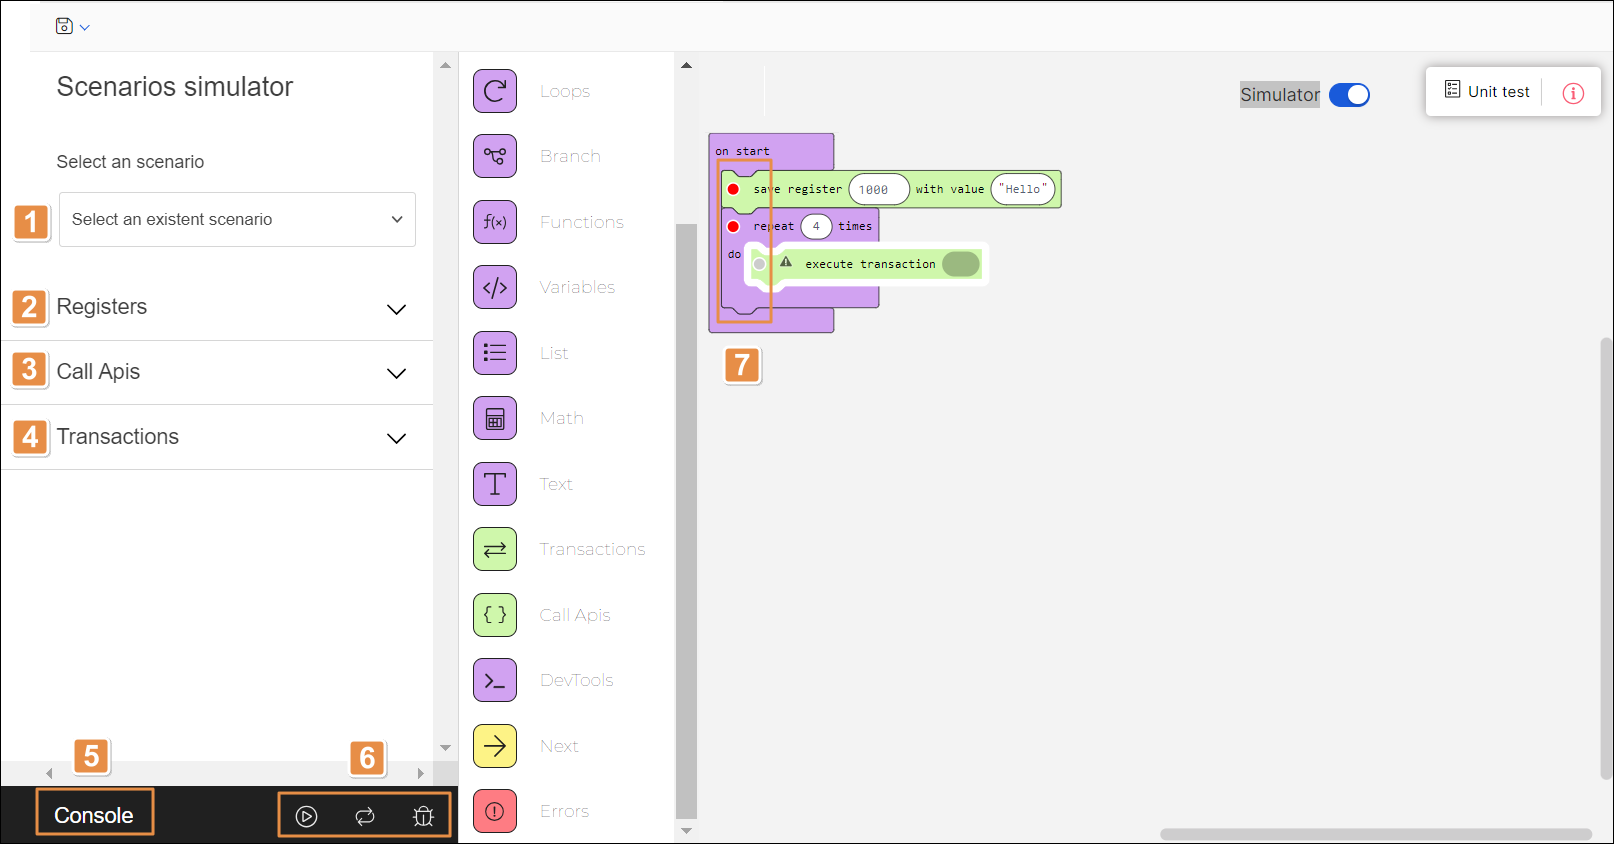
Scenarios drop-down menu. Click the down arrow and select a scenario. Each scenario may contain specific parameters for registers, call APIs or transactions. Read Create a Scenario to learn more.
Note
Changes made to the parameters only affect the simulation in process but won't affect the scenario's original settings.
Registers. List of registers set for the scenario. Click the arrow to collapse or expand the section. To add a new register, click + Add register. Then, complete the following fields.
Output
ID of the register where the value will be stored. Click the field and enter the register number or use the arrows to find the desired number.
value
Value you want the register to hold for this simulation. Click the field and enter the value.
Call Apis. List of call APIs set for the scenario. Click the arrow to collapse or expand the section. Click Select a call api and select one of the call APIs available. The list of expected results contains the following fields:
Output
ID of the register where the value will be stored. The system completes this field based on the configuration of the selected call API. Click the information icon to the right of the output value to see the description.
value
Value you want the register to hold for this simulation. Click the field and enter the value.
To add more call APIs, click + Add call api and follow the instructions specified above. To delete a call API, click Delete (trashcan icon located to the right).
Transactions. List of transactions set for the scenario. Click the arrow to collapse or expand the section. Click the down arrow and select a transaction from the drop-down menu. Then, you can set success results, a predefined error simulation or a custom error simulation for the transaction. The Success results option is selected by default. Refer to the table below to learn more.
Success results
Select this option to set the results expected from the lambda process. The list of expected results appears with the following fields:
Output
ID of the register where the value will be stored. The system completes this field with the register number based on the configuration of the selected transaction. Click the information icon to see the register name.
Value
Value you want the register to hold for this simulation. Click the field and enter the value.
Predefined error simulation
Select this option to choose a predefined error and set the error to be executed after the predefined error occurs. You must fill in the following fields.
Predefined error
Click the down arrow and select one of the errors from the drop-down menu. The options available are: Connection Timeout, Disconnect Internet, Update Application and Update Configuration.
Error type
Click the down arrow and select one of the error types from the drop-down menu. The options available are: Error, Event and Local. By default, the Local type is selected. To learn more about types of errors, read Settings.
Error code
Click the field and fill in with the desired error code. Note that only the numbers in the error code must be included. For example, to set the error UA213, the error code to be included would be 213.
Custom error simulation
Select this option to choose a predefined error and set the error to be executed after the predefined error occurs. You must complete the following fields.
Error type
Click the down arrow and select one of the error types from the drop-down menu. The options available are: Error, Event and Local. By default, the Local type is selected.
Error code
Click the field and complete with the desired error code. Note that only the numbers in the error code must be included.
To add more transactions, click + Add transaction and follow the instructions specified above. To delete a transaction, click Delete (trashcan icon) located to the right of each transaction.
Console. Click to open the console log and read the log of the process run by the simulator.
Simulator actions. Refer to the table below to learn more about the actions available within the simulator.

Once you click the Simulator toggle, the simulation process starts running automatically. Click Stop the simulator to stop the simulation.

Click Start the simulator to run the process again. The previous simulation will disappear from the console log. This button appears only after you stop the simulation.

Click Restart the simulator to run the process again. The previous simulation won't disappear from the console log.

Click Toggle debug mode to open the debugging tool. It starts running the process automatically. Refer to the table below to learn more.
Variables
Variables within the lambda process. While the process is running, this section contains the message Code is running.... Each variable identified by the debugging tool appears listed in this section. Variables in one block appear listed only after the following block is executed. If no variables are identified, this section contains the message No variables to show.

Click Step into so that the tool executes the current block and moves to the next block of the lambda process.

Click Pause execution to pause the code execution.

Click Continue execution so that the tool executes the code until it reaches the final block of the lambda or up to the next breakpoint. This button appears only if you previously paused the execution or if the execution paused because a breakpoint was set in any of the blocks.

Click Restart debugging to start the code execution again from the first block of the lambda process.

Click Slow-Mo to slow down the debugging tool's speed.
Breakpoint. To set one or more breakpoints, click the circular button to the left of each block of the lambda. Once selected, the button turns red.
To edit the configuration of a process, navigate through the list of lambda process to find the desired one, click the vertical three-dot icon and then click Edit.