Transaction Log
The Transaction Log page allows you to obtain a log of every transaction that is being executed in the platform and their responses. This log helps in the process of testing transactions, detecting errors, and giving support to fix them. To access this page, click Transaction Log in the top menu or System > Transactions > Transaction Log.
See the annotated image below to learn more.
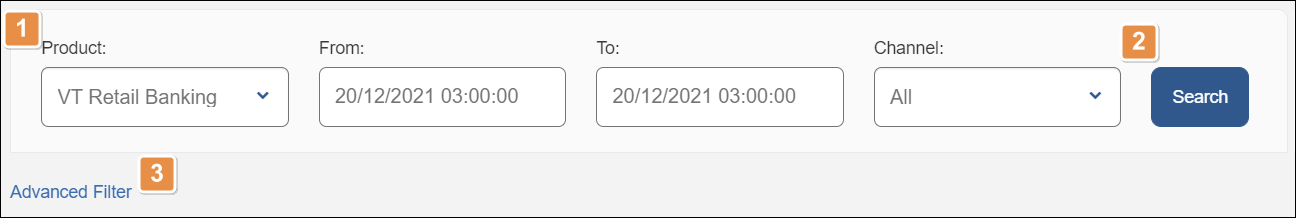
Filters. Use these fields to filter the transactions you want to obtain in the log.
Product
Select the product from the drop-down menu.
From
Select a start date and time.
To
Select an end date and time. Keep in mind there might be a time limit that varies depending on the environment. This time limit is disabled when there is an advanced filter set.
Channel
Select the channel from the drop-down menu.
Search. Click to obtain a list of the transactions that match your filters.
Advanced filters. Click to open a set of optional advanced filters.
Transaction Code
Filter transactions by transaction code. This drop-down menu lists every transaction configured in the Auth section of the Product menu.
Terminal Id
Type the ID of the device where the transaction is being executed.
Response Code
Click to select a specific response code. This drop-down menu lists every response code created in the Device section of the Product menu.
Seq #
Enter a transaction sequence number.
Client Id
Enter the client ID to filter for a specific client.
Institution
Choose an institution from the drop-down menu. This drop-down menu lists institutions already configured in the Auth section of the Product menu.
Account Id
Enter an Account ID to filter by an account associated to a client.
Items to Display
Select the number of transaction registers you want to obtain in the search.
Release candidate
This drop-down menu lists the release candidate groups configured in a Blue-Green experiment. This feature may not be available in your environment.
Click Search to see transactions in a list with one row per transaction and columns that show each transaction's basic information. In the Actions column, click View Detail (eye icon) to open the Transactions Detail modal window, where you can read more information about the selected transaction.
Below the advanced filters, right above the transactions list, you can find a series of actions you can perform after clicking Search. Click CSV or PDF to download the list of transactions as a .cvs or a .pdf file. Additionally, click Help if you need further information about the filters you can apply during your search.
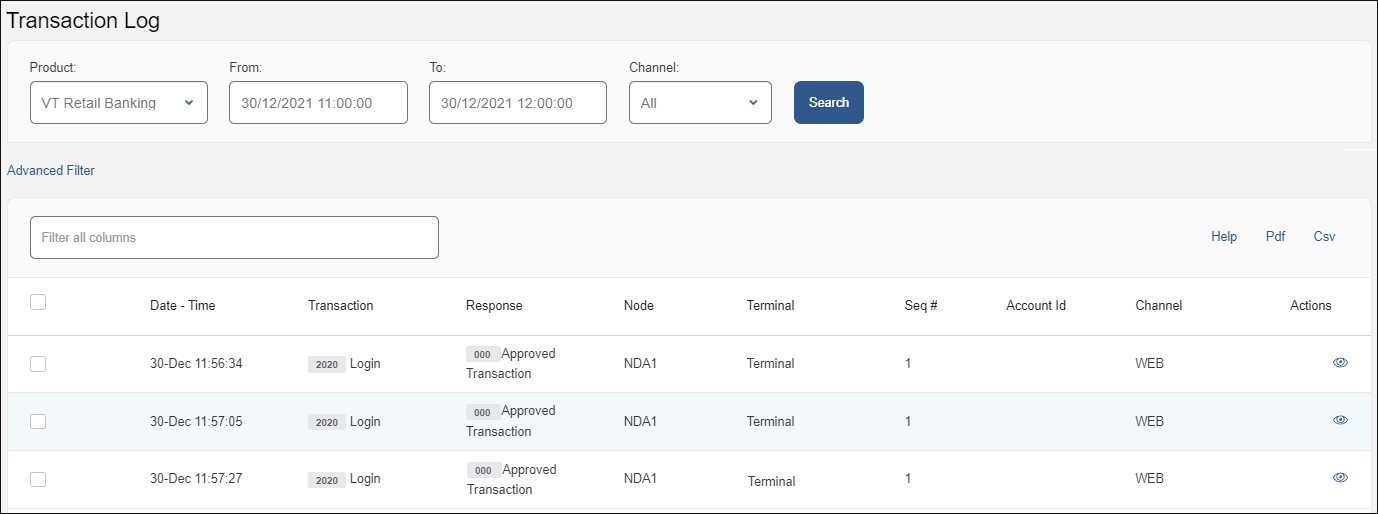
Use the paginated links below the list to move between pages in the log.
Transaction Detail
The Transaction Detail modal window is divided into three sections and shows different types of information about the transaction and the device where it was executed. See the annotated image below to learn more.
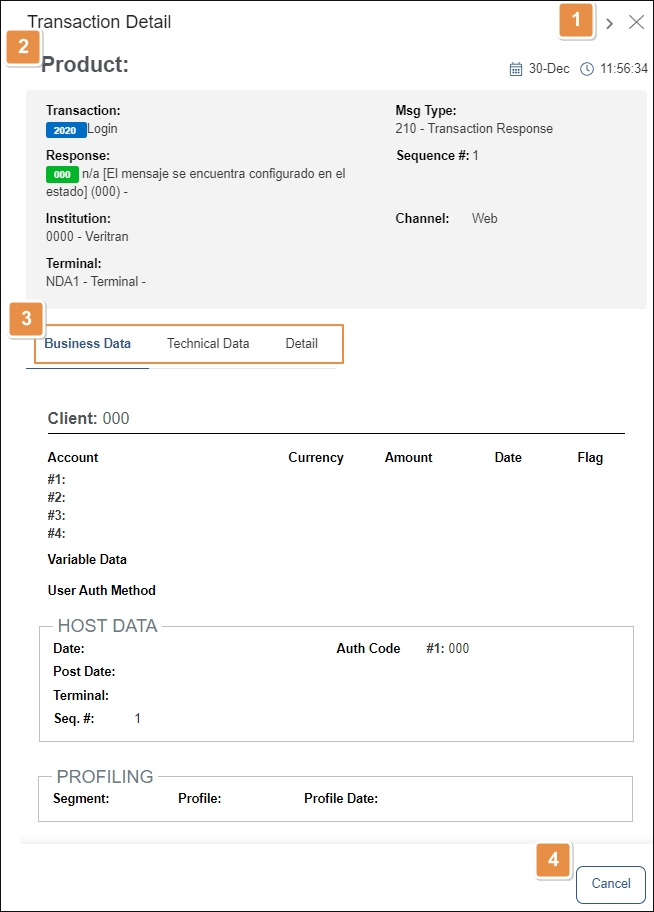
Actions.
Next
Move to the next transaction.
Close
Close the window.
Product section. Indicates date and time when the selected transaction was executed. It also contains general information about the transaction, such as response and sequence number, and message type.
Tabs. There are three tabs that display different types of data about the transaction: Business Data, Technical Data, and Detail. Read below for more detailed information about what you can find on each tab.
This tab contains information about the host, client, and profiles. It opens by default when you open the Transaction Details window.
Client | In this section, you can find the ID of the client involved in the transaction and other information retrieved from the transaction, such as the account, currency, amount, date and flag. The Variable Data field contains information that is returned by the transaction, and the User Auth Method field indicates the authentication method used. |
Host Data | In this section, you can read details related to the operating system of the device involved in this transaction, date, authentication code, post date, terminal ID, and sequence number. |
Profiling | This section contains information about the profile that was used for the transaction and type of configuration. |
This section contains more detailed and technical information about the transaction, such as the node where it originated, the transaction version, the entry time and the last step of the transaction.
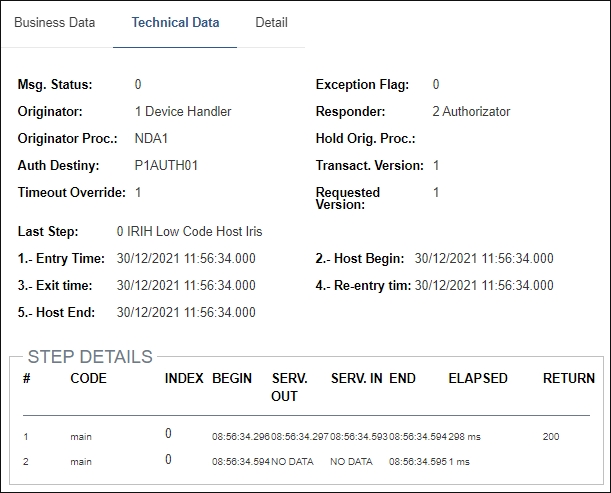
Below, the Step Details section shows information about each step of the transaction's logic, such as its duration.
This section shows information about the device where the transaction was executed, such as the device and the operating system. The information is divided into different numbered fields, depending on the information available.