Simulator
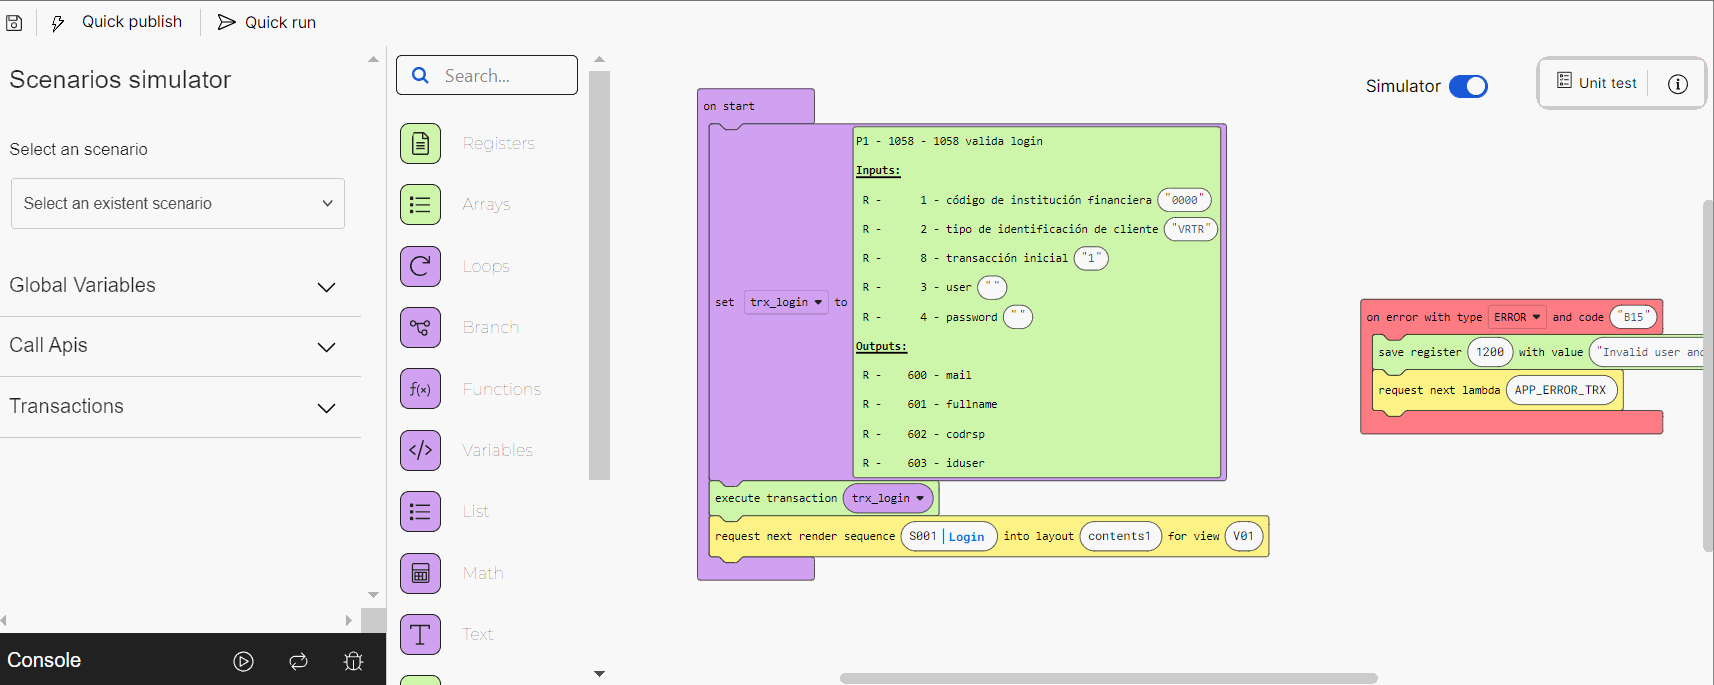
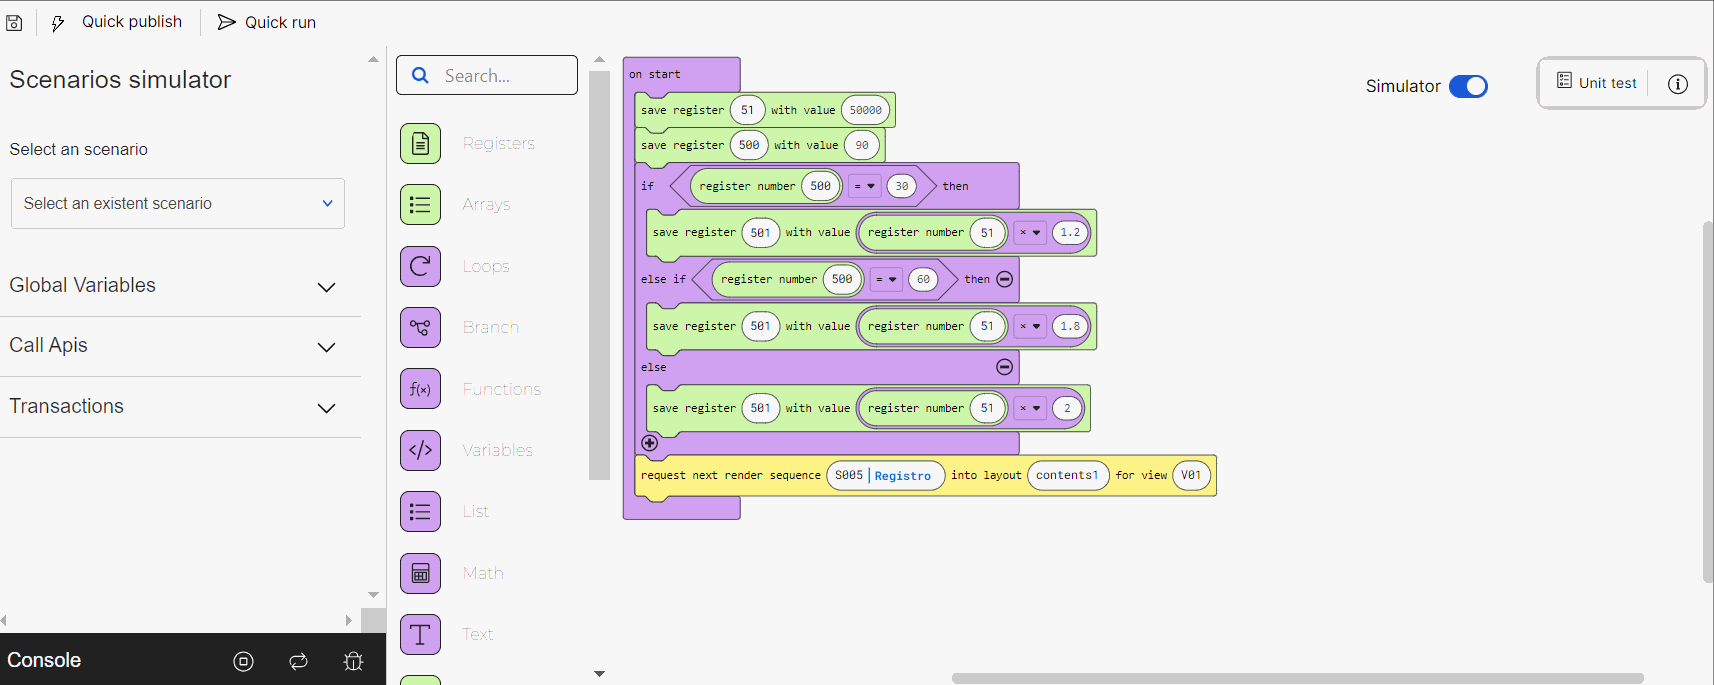
The simulator tool allows you to test the logic of the lambda process by providing it with the input data required to work as expected. To open it, click the Simulator toggle. Once it is activated, the toggle turns blue and the simulator panel opens to the left of the canvas. The simulation starts running automatically once the simulator is activated.
Note
The option to select a scenario created with the Quality Assurance feature is currently not available and should not be used.
The simulator also contains a debugging tool. This tool allows you to execute the lambda process code step by step and find any programming errors within the blocks. To run the debug, you can also set breakpoints to pause the debug in specific block or blocks, and see them in detail.
At the bottom of the simulator panel, you can find the Console option, that allows you to open the console log and read the log of the process run by the simulator to see if it works as expected.
The input data you may add to mock and test the logic of your process includes: global variables, call APIs and transactions. Read below to learn how to set each of them.
Global variables. List of global variables set for the simulation. To add a new variable, click + Add global variable. Then, complete the following fields:
Output
ID of the register where the value will be stored. Click the field and enter the register number or use the arrows to find the desired number.
value
Value you want the register to hold for this simulation. Click the field and enter the value.
Call APIs. List of call APIs set for the simulation. Click Select a call api and select one of the call APIs available. The list of expected results contains the following fields:
Output
ID of the register where the value will be stored. The system completes this field based on the configuration of the selected call API. Click the information icon to the right of the output value to see the description.
value
Value you want the register to hold for this simulation. Click the field and enter the value.
To add more call APIs, click + Add call api and follow the instructions specified above. To delete a call API, click the trashcan icon to the right of each call API.
Transactions. List of transactions set for the simulation. Click the down arrow and select a transaction from the drop-down menu. Then, you can set success results, a predefined error simulation or a custom error simulation for the transaction. The Success results option is selected by default. Refer to the table below to learn more.
Success results
Select this option to set the results expected from the lambda process. The list of expected results appears with the following fields:
Output
ID of the register where the value will be stored. The system completes this field with the register number based on the configuration of the selected transaction. Click the information icon to see the register name.
Value
Value you want the register to hold for this simulation. Click the field and enter the value.
Predefined error simulation
Select this option to choose a predefined error and set the error to be executed after the predefined error occurs. You must fill in the following fields.
Predefined error
Click the down arrow and select one of the errors from the drop-down menu. The options available are: Connection Timeout, Disconnect Internet, Update Application and Update Configuration.
Error type
Click the down arrow and select one of the error types from the drop-down menu. The options available are: Error, Event and Local. By default, the Local type is selected. To learn more about types of errors, read Settings.
Error code
Click the field and fill in with the desired error code. Note that only the numbers in the error code must be included. For example, to set the error UA213, the error code to be included would be 213.
Custom error simulation
Select this option to choose a predefined error and set the error to be executed after the predefined error occurs. You must complete the following fields.
Error type
Click the down arrow and select one of the error types from the drop-down menu. The options available are: Error, Event and Local. By default, the Local type is selected.
Error code
Click the field and complete with the desired error code. Note that only the numbers in the error code must be included.
To add more transactions, click + Add transaction and follow the instructions specified above. To delete a transaction, click the trashcan icon to the right of each transaction.
The actions available for your simulation include:
| Once you click the Simulator toggle, the simulation process starts running automatically. Click Stop the simulator to stop it. |
| Click Start the simulator to start running the process again. The previous simulation will disappear from the console log. This button appears only after you stop the simulation. |
| Click Restart the simulator to start running the process again. The previous simulation won't disappear from the console log. |


Next to the simulation actions you can also find the debug mode icon  . Click the icon to open the debugging tool. It starts running the process automatically. To set one or more breakpoints to the debugging process, click the circular button to the left of each block of the lambda. Once selected, the button turns red.
Refer to the table below to learn more about the tool.
Variables | Variables within the lambda process. While the process is running, this section contains the message Code is running.... Each variable identified by the debugging tool appears listed in this section. Variables in one block appear listed only after the following block is executed. If no variables are identified, this section contains the message No variables to show. |
| Click Step into so that the tool executes the current block and moves to the next block of the lambda process. |
| Click Pause execution to pause the code execution. |
| Click Continue execution so that the tool executes the code until it reaches the final block of the lambda or up to the next breakpoint. This button appears only if you previously paused the execution or if the execution paused because a breakpoint was set in any of the blocks. |
| Click Restart debugging to start the code execution again from the first block of the lambda process. |
| Click Slow-Mo to slow down the debugging tool's speed. |


