Simulator
Con la herramienta de simulador, puedes probar la lógica del proceso lambda y proporcionarle al lambda los datos de entrada requeridos para que funcione según lo esperado.

Nota
[en] The option to select a scenario created with the Quality Assurance feature is currently not available and should not be used.
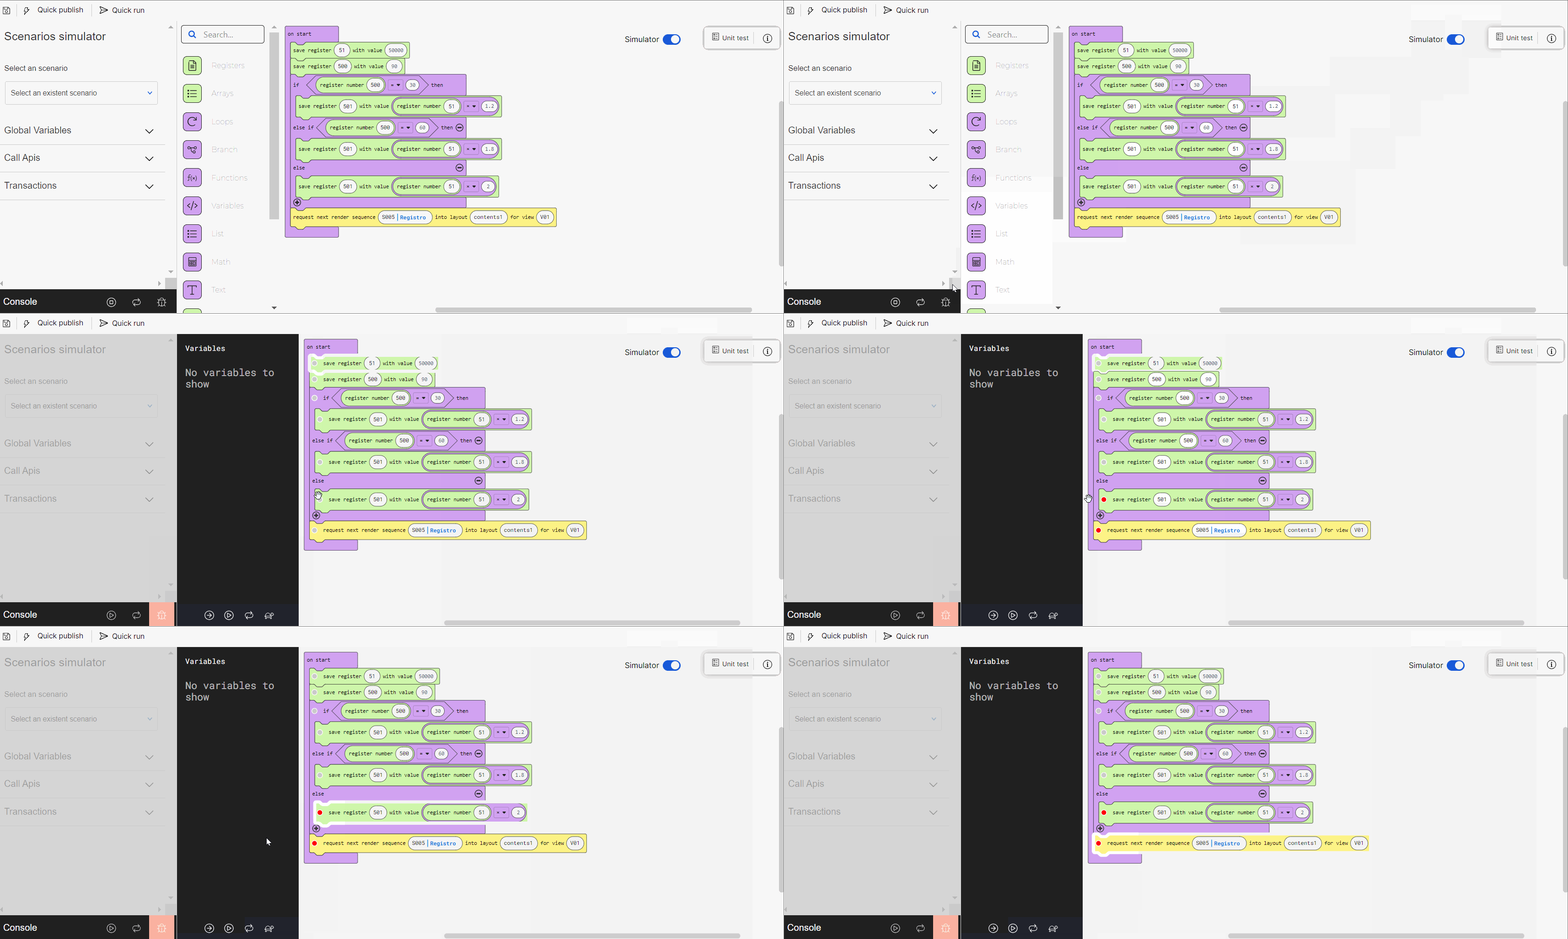
[en] The simulator also contains a debugging tool. This tool allows you to execute the lambda process code step by step and find any programming errors within the blocks. To run the debug, you can also set breakpoints to pause the debug in specific block or blocks, and see them in detail.
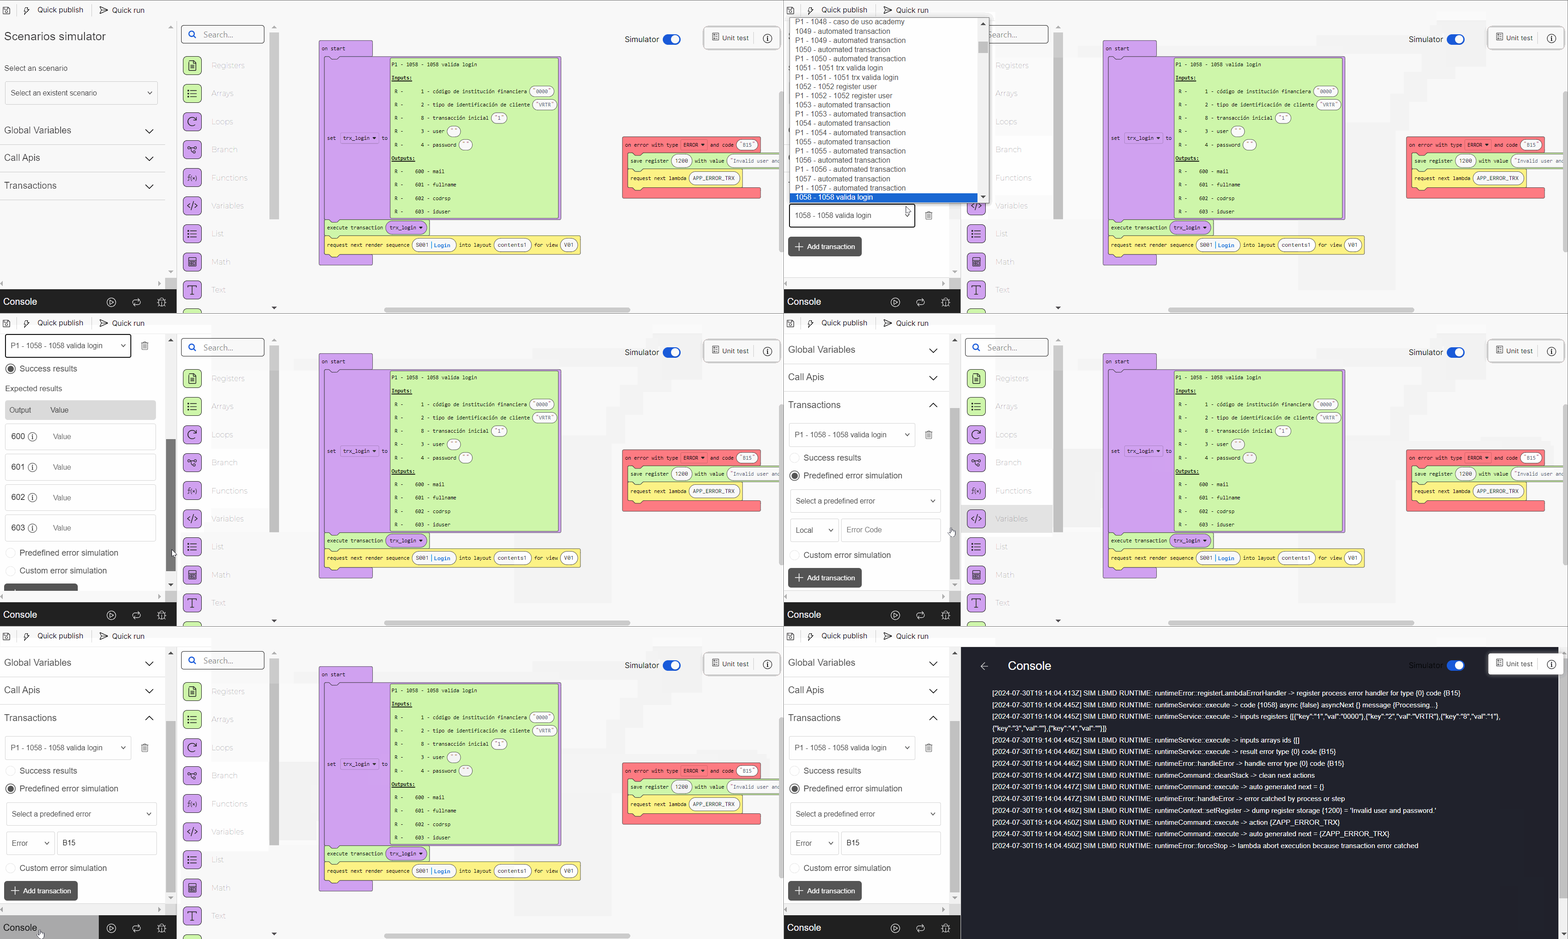
[en] At the bottom of the simulator panel, you can find the Console option, that allows you to open the console log and read the log of the process run by the simulator to see if it works as expected.
[en] The input data you may add to mock and test the logic of your process includes: global variables, call APIs and transactions. Read below to learn how to set each of them.
[en] Global variables. List of global variables set for the simulation. To add a new variable, click + Add global variable. Then, complete the following fields:
Output
[en] ID of the register where the value will be stored. Click the field and enter the register number or use the arrows to find the desired number.
Value
Introduce el valor que quieres que el registro tenga para este escenario. Haz clic en el campo e introduce el código.
Call APIs
Output
[en] ID of the register where the value will be stored. The system completes this field based on the configuration of the selected call API. Click the information icon to the right of the output value to see the description.
Value
Introduce el valor que quieres que el registro tenga para este escenario. Haz clic en el campo e introduce el código.
[en] To add more call APIs, click + Add call api and follow the instructions specified above. To delete a call API, click the trashcan icon to the right of each call API.
Transactions Consulta la tabla a continuación para obtener más información.
Success results
[en] Select this option to set the results expected from the lambda process. The list of expected results appears with the following fields:
Output
[en] ID of the register where the value will be stored. The system completes this field with the register number based on the configuration of the selected transaction. Click the information icon to see the register name.
Value
Introduce el valor que quieres que el registro tenga para este escenario. Haz clic en el campo e introduce el código.
Predefined error simulation
Selecciona esta opción para elegir un error predefinido y establece que el error se ejecute luego de que ocurra el error predefinido. Debes completar los campos siguientes. Completa los siguientes campos:
Predefined error
Las opciones disponibles son:
Error type
Las opciones disponibles son:
Error code
[en] Click the field and fill in with the desired error code. Note that only the numbers in the error code must be included. For example, to set the error UA213, the error code to be included would be 213.
Custom error simulation
Selecciona esta opción para elegir un error predefinido y establece que el error se ejecute luego de que ocurra el error predefinido. Debes completar los campos siguientes.
Error type
Las opciones disponibles son:
Error code
[en] Click the field and complete with the desired error code. Note that only the numbers in the error code must be included.
[en] To add more transactions, click + Add transaction and follow the instructions specified above. To delete a transaction, click the trashcan icon to the right of each transaction.
[en] The actions available for your simulation include:
| [en] Once you click the Simulator toggle, the simulation process starts running automatically. Click Stop the simulator to stop it. |
| [en] Click Start the simulator to start running the process again. The previous simulation will disappear from the console log. This button appears only after you stop the simulation. |
| [en] Click Restart the simulator to start running the process again. The previous simulation won't disappear from the console log. |
[en] Next to the simulation actions you can also find the debug mode icon  . Click the icon to open the debugging tool. It starts running the process automatically. To set one or more breakpoints to the debugging process, click the circular button to the left of each block of the lambda. Once selected, the button turns red.

Consulta la siguiente tabla para obtener más información sobre cada opción.
Variables | [en] Variables within the lambda process. While the process is running, this section contains the message Code is running.... Each variable identified by the debugging tool appears listed in this section. Variables in one block appear listed only after the following block is executed. If no variables are identified, this section contains the message No variables to show. |
| Haz clic en Step into para que la herramienta ejecute el bloque actual y se mueva hacia el bloque siguiente del proceso lambda. |
| Haz clic en Pause execution para pausar la ejecución del código. |
| [en] Click Continue execution so that the tool executes the code until it reaches the final block of the lambda or up to the next breakpoint. This button appears only if you previously paused the execution or if the execution paused because a breakpoint was set in any of the blocks. |
| Haz clic en Restart debugging para comenzar nuevamente la ejecución del código desde el primer bloque del proceso lambda. |
| Haz clic en Slow-Mo para disminuir la velocidad de la herramienta de depuración1. |


